Hourly and 10-day forecasts
On this page
Two tabs on a place's page go deeper than the Today page. Hourly shows the next 48 hours as a chart and a table. 10-Day shows each of the next ten days in detail, with a day half and a night half.
#Hourly
Open a place and select Hourly.
#The chart
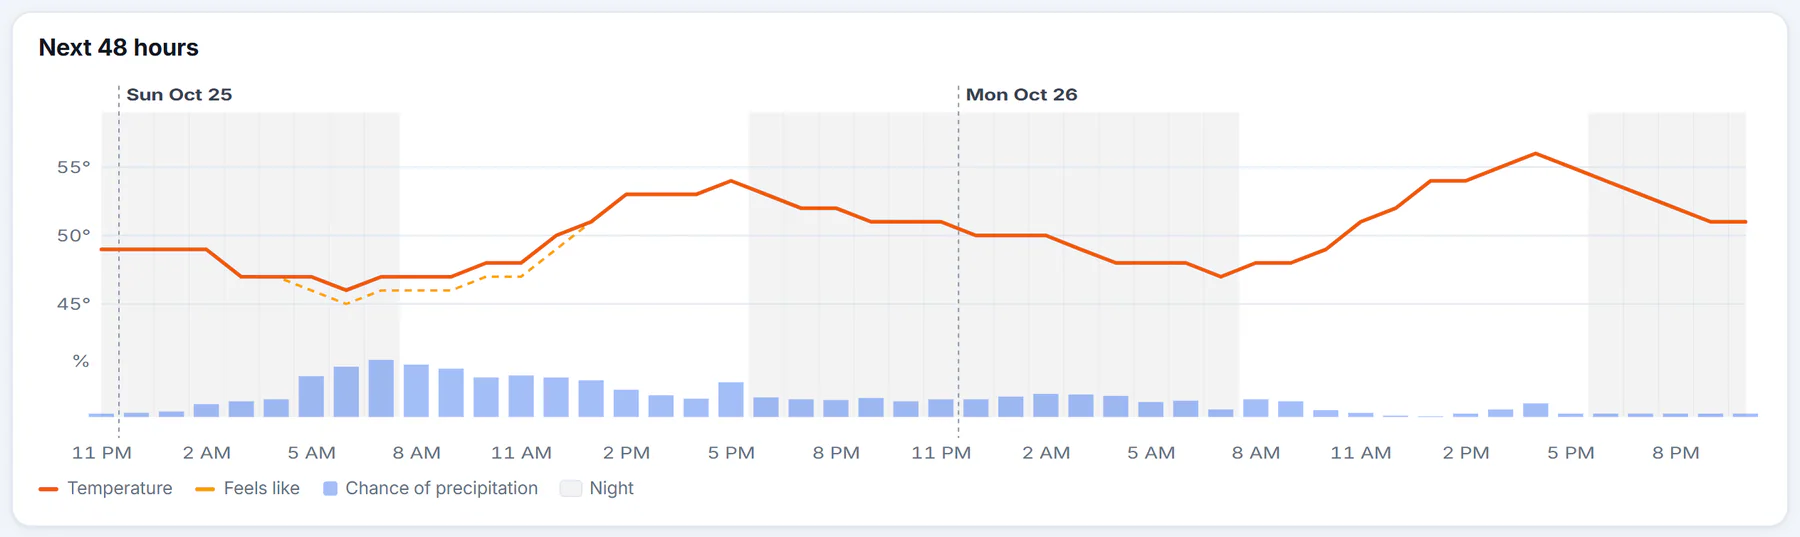
The next 48 hours. The legend at the bottom names each line and the bars.
- 1Temperature
- 2Feels like
- 3Chance of precipitation: the bars
- 4Night hours are shaded
- Temperature is the solid line and Feels like a second, thinner line that follows it. The temperatures on the left are in your units.
- Chance of precipitation is the row of bars at the bottom, from 0% to 100%.
- Night hours are shaded, so you can see the day's rhythm.
- A dashed line marks each new day, with its date. The hours are labeled along the bottom, every third hour.
#The table
Below the chart, each day has a block that you select to open or close. The first two are open. Each shows one row per hour.
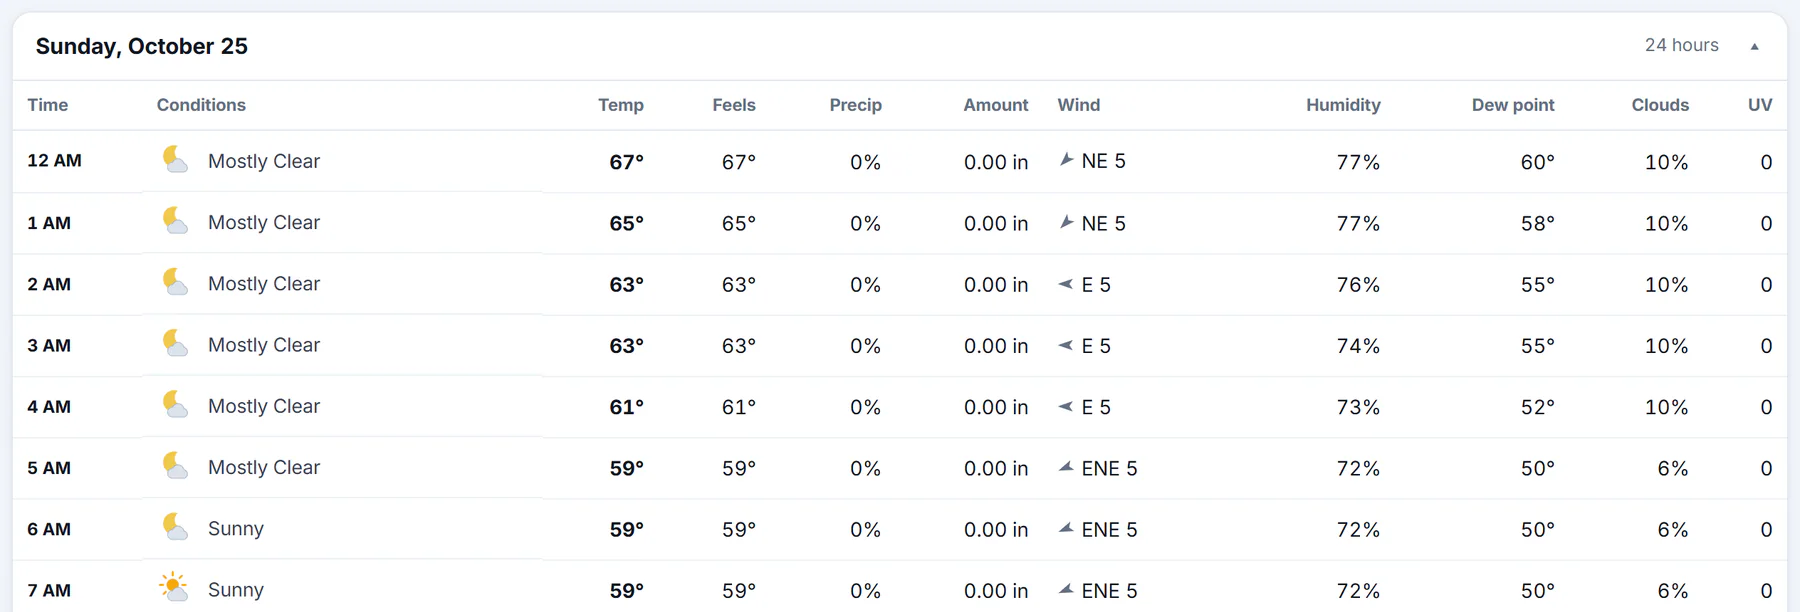
One day of the hourly table. A day's heading shows how many hours it lists.
- 1A day: select to open or close it
- 2Temperature
- 3Chance of precipitation
- 4Wind
| Column | What it means |
|---|---|
| Time | The hour, in the place's own time |
| Conditions | An icon and words |
| Temp and Feels | The temperature and what it feels like |
| Precip | The chance of precipitation |
| Amount | How much is expected that hour, as liquid |
| Snow | Snow expected, shown only when there is some |
| Wind | Where the wind comes from and its speed, with an arrow showing where it is blowing, and gusts when they are noticeably stronger |
| Humidity, Dew point, Clouds | Moisture and cloud cover |
| UV | The UV index, when available. See Air quality and the UV index |
The first day starts at the current hour, so on an evening it may list only a few hours. Precipitation amounts are the forecast liquid equivalent for each hour. For places outside the United States, the hourly detail covers about two and a half days.
#10-Day
Select 10-Day. An Overview list comes first, with a row for each day. Under it is a box for each day.
On the Today page, the same list appears as the 10-day forecast box. Its rows are:
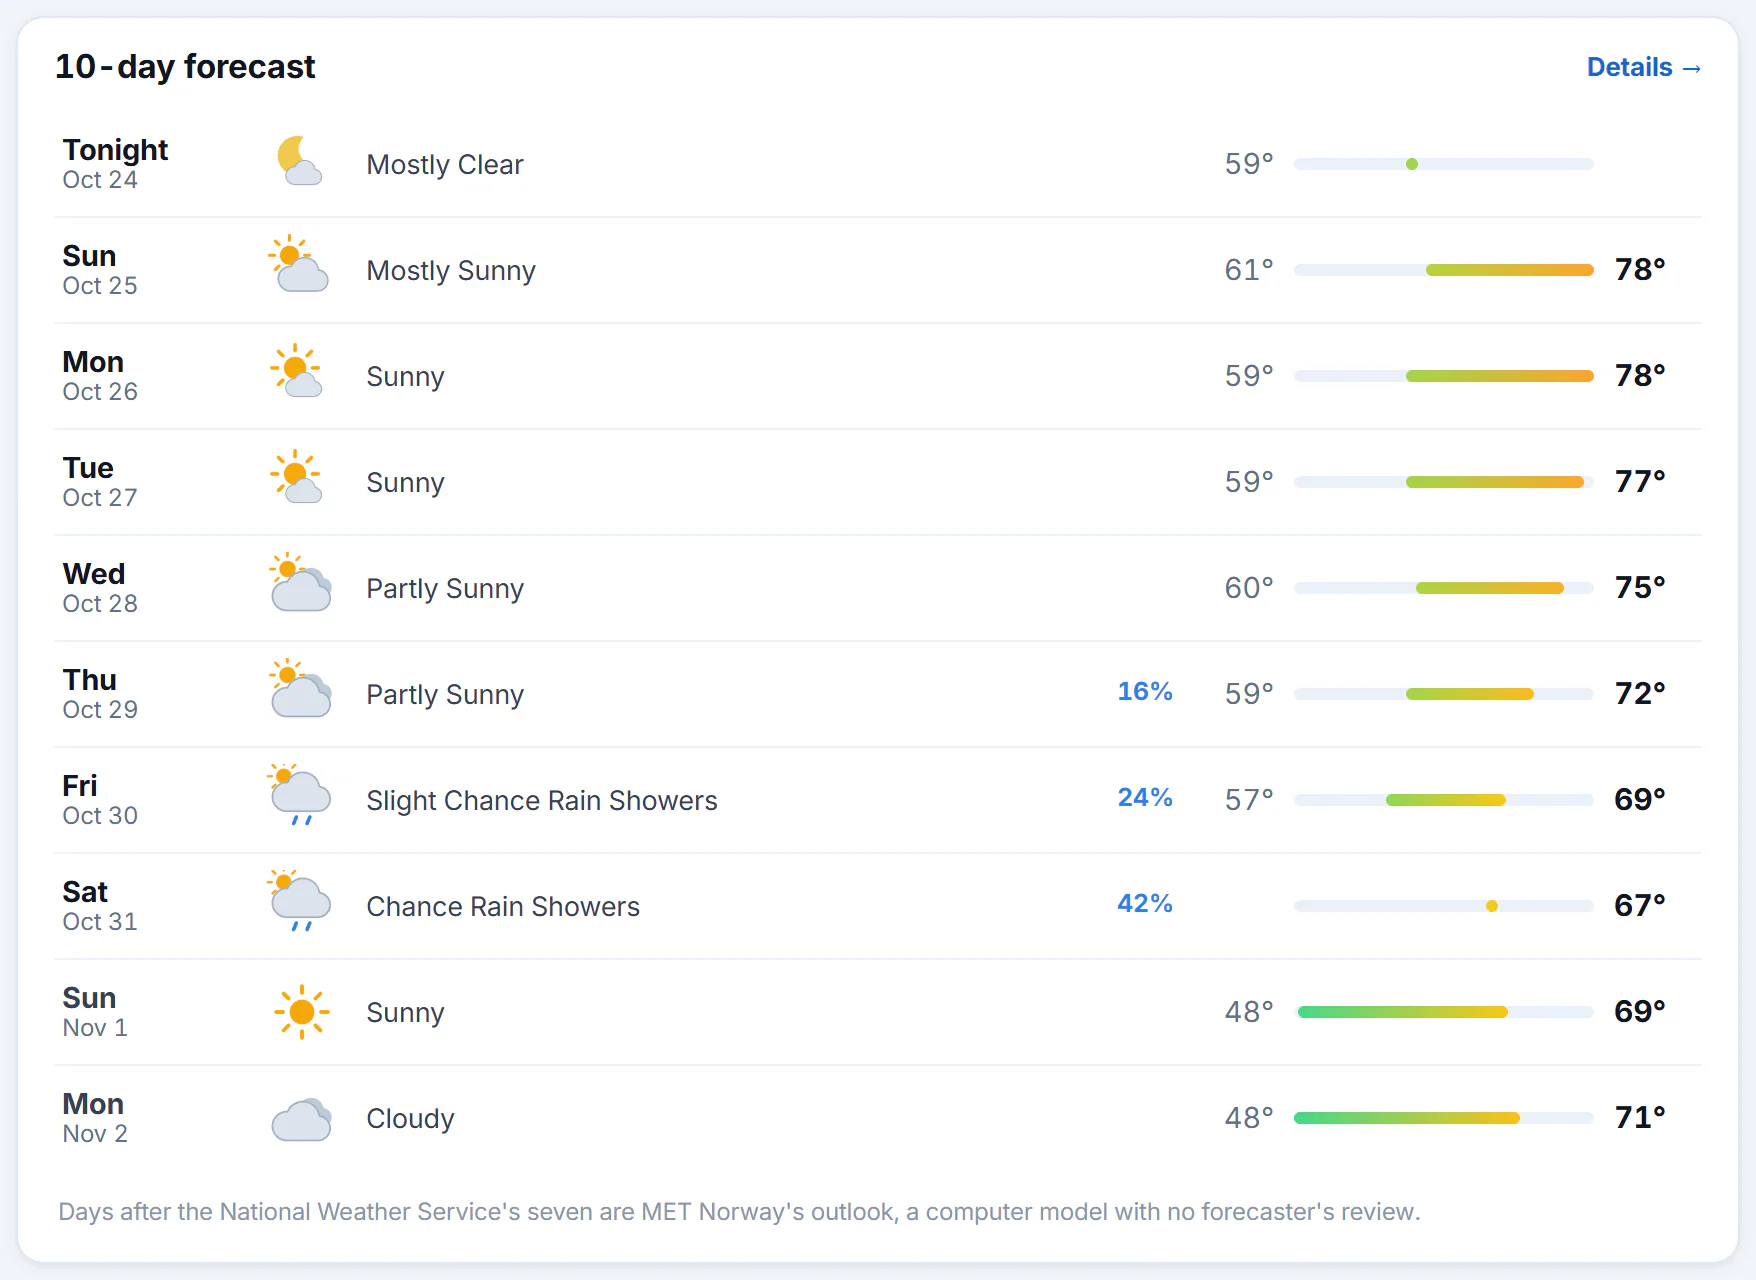
The 10-day list. Select a row to open that day's box on the 10-Day tab.
- 1The day and date
- 2Conditions in words
- 3Chance of precipitation
- 4The low, the range and the high
- 5Days beyond seven are a model's outlook
Each row shows the day and date, an icon, the conditions in words, the chance of precipitation when it is 10% or more, the low, a bar that shows the day's range against the other days, and the high. A note beside the conditions shows the snow expected, when there is some.
#A day in detail
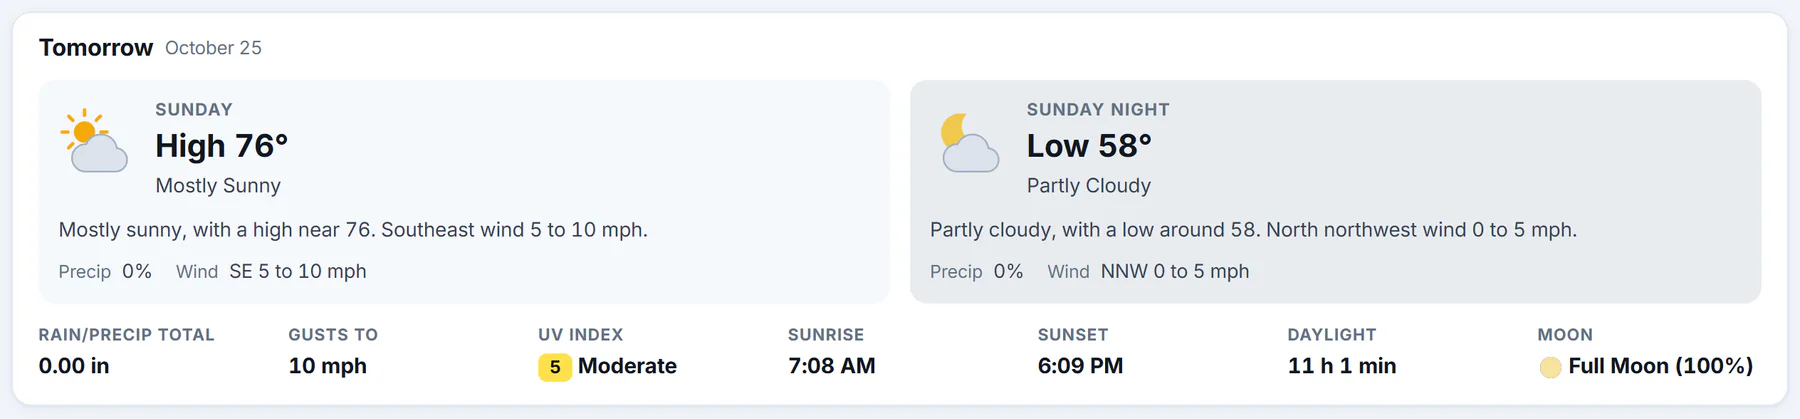
One day of the 10-Day tab: the day half, the night half and the figures for the whole day.
- 1The day half
- 2The night half
- 3Totals, gusts, UV, sun and moon
- The day half and the night half each give an icon, the high or the low, the conditions, the forecasters' words, the chance of precipitation and the wind.
- The figures for the whole day list, where they apply, the rain or precipitation total, snow, ice, the strongest gusts, the chance of thunder, the UV index, sunrise, sunset, the length of daylight and the moon's phase with how much of it is lit.
#The last days
For a U.S. place, the National Weather Service forecasts the first seven days. The days after that come from MET Norway's outlook, a computer model that no forecaster has reviewed. They carry an Extended outlook tag, and the list says the same in a note. Expect them to change more than the first seven.
#Common questions
Why does the hourly table start part-way through the day?
It starts at the current hour in the place's time. Earlier hours are not repeated.
Which way is the wind blowing?
The letters give the direction the wind comes from, so W 5 is a west wind at 5 mph. The arrow beside them points the way the wind is blowing, which is the opposite way.
Why are some columns missing from the table?
Snow and UV appear only when the forecast has something to show in them.
What does "Amount" mean?
The forecast depth of liquid for that hour: rain, or the water in snow. The 10-Day boxes show snowfall as snow depth.
Why do the last days of the 10-day list look less exact?
They come from a computer model rather than forecasters, and forecasts lose accuracy the further ahead they look.